Image Analysis
Thresholding
The qim3d library offers many functionalities for image analysis. First, qim3d is imported:
import qim3d
downloader = qim3d.io.Downloader()
volume = downloader.Mussel.ClosedMussel1_DOWNSAMPLED(load_file=True)
One can interactively find fitting thresholds for volume segmentation using different methods, and see how they segment the volume in different slices:
# Load a sample volume
vol = qim3d.examples.bone_128x128x128

# Visualize interactive thresholding
qim3d.viz.threshold(vol)
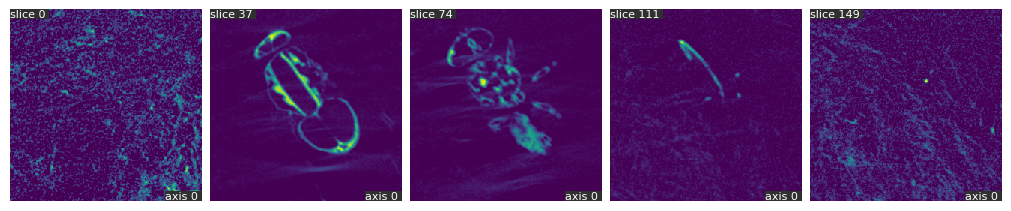
Filter pipelines
The qim3d library offers multiple filters for image analysis. They can also be combined into a single pipeline that is applied sequentially:
from qim3d.filters import Pipeline, Median, Gaussian, Maximum, Minimum
# Get data
vol = qim3d.examples.fly_150x256x256
# Show original
fig1 = qim3d.viz.slices_grid(vol, num_slices=5, display_figure=True)
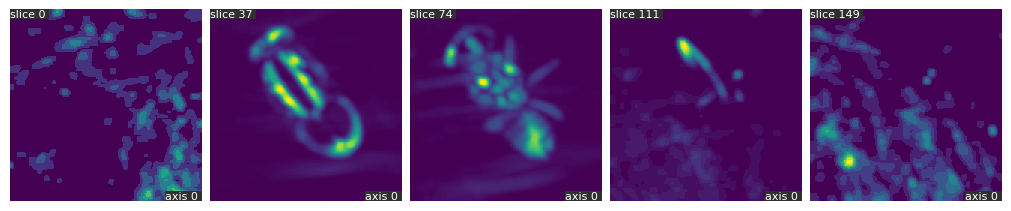
# Create filter pipeline
pipeline = Pipeline(
Median(size=5),
Gaussian(sigma=3, dask = True)
)
# Append a third filter to the pipeline
pipeline.append(Maximum(size=3))
# Apply filter pipeline
vol_filtered = pipeline(vol)
# Show filtered
fig2 = qim3d.viz.slices_grid(vol_filtered, num_slices=5, display_figure=True)
BLOB detection
Blobs can be extracted from volumes using the Difference of Gaussians (DoG) method:
# Get data
vol = qim3d.examples.cement_128x128x128
vol_blurred = qim3d.filters.gaussian(vol, sigma=2)

# Detect blobs, and get binary_volume
blobs, binary_volume = qim3d.detection.blobs(
    vol_blurred,
    min_sigma=1,
    max_sigma=8,
    threshold=0.001,
    overlap=0.1,
    background="bright"
    )

# Visualize detected blobs
qim3d.viz.circles(blobs, vol, alpha=0.8, color='blue')
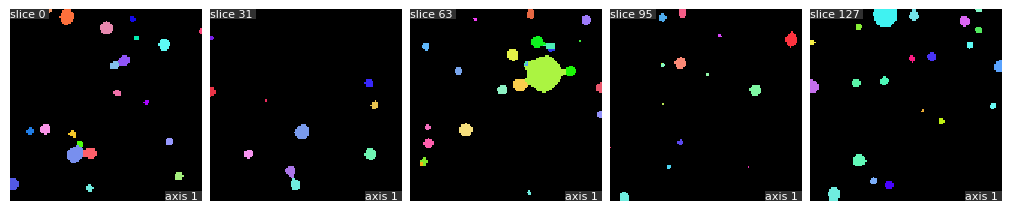
Segmentation
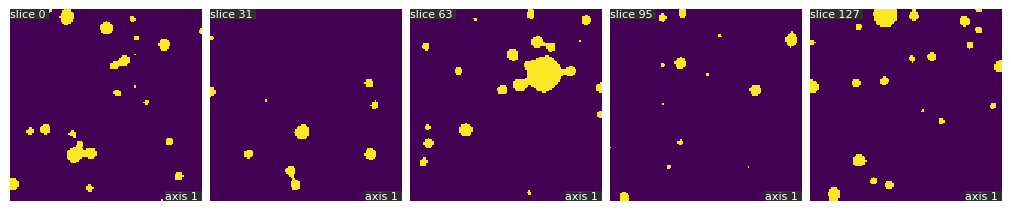
Binary volumes can be segmented using the watershed algorithm:
import qim3d

vol = qim3d.examples.cement_128x128x128
bin_vol = qim3d.filters.gaussian(vol, sigma = 2)<60

fig1 = qim3d.viz.slices_grid(bin_vol, slice_axis=1, display_figure=True)
labeled_volume, num_labels = qim3d.segmentation.watershed(bin_vol)

cmap = qim3d.viz.colormaps.segmentation(num_labels)
fig2 = qim3d.viz.slices_grid(labeled_volume, slice_axis=1, color_map=cmap, display_figure=True)