Visualization
The qim3d library allows for quick and easy visualization of volumetric data. First, qim3d is imported, and a mussel volume is loaded:
import qim3d
downloader = qim3d.io.Downloader()
volume = downloader.Mussel.ClosedMussel1_DOWNSAMPLED(load_file=True)
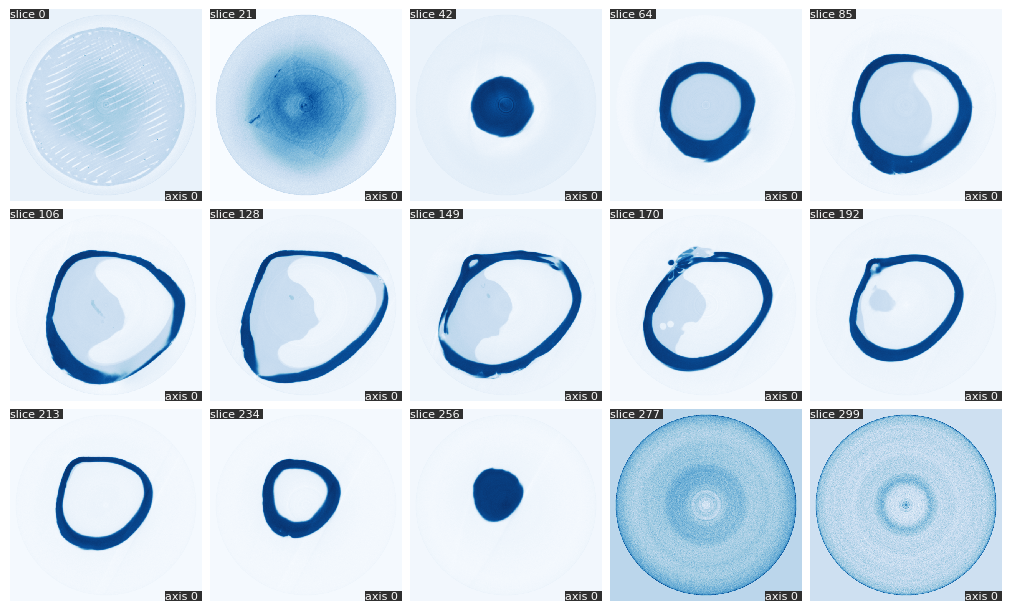
Slices
Equidistant slices of the mussel µCT-scan can be viewed. Here 15 slices are chosen:
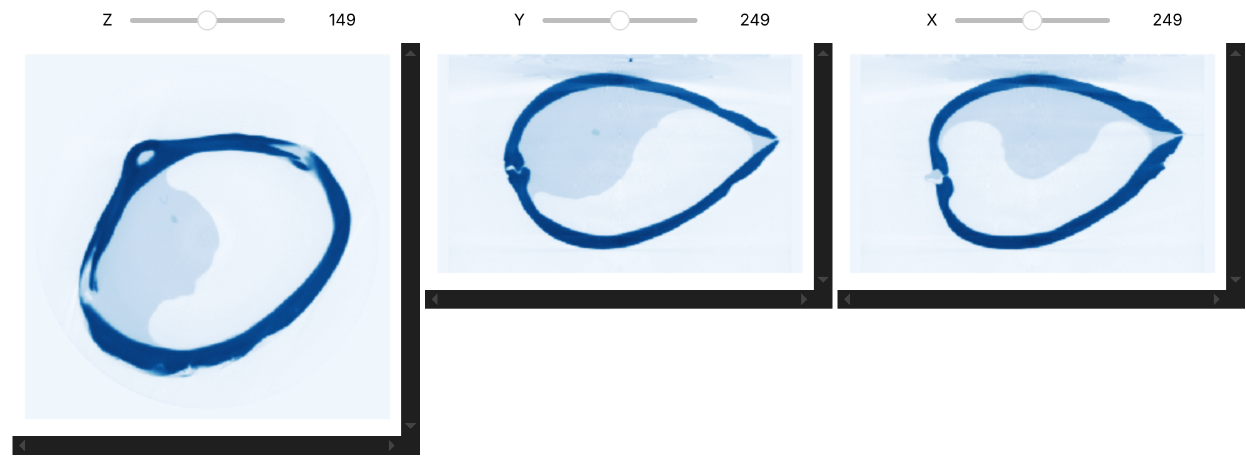
One can interactively scroll through the different axes of the volume:
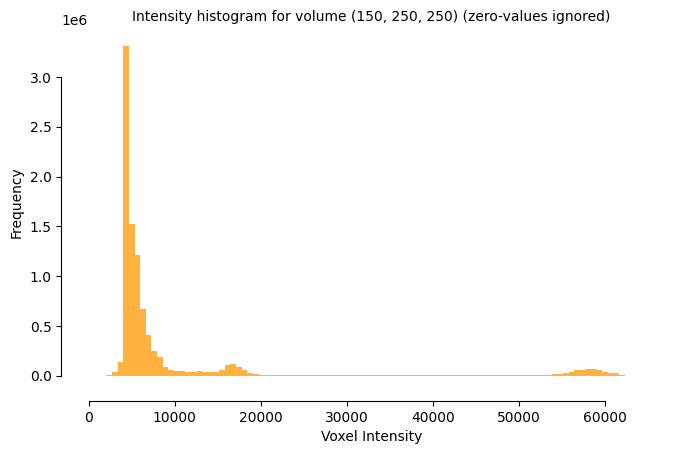
Histogram
Histograms of the voxel intensities from a volume can help detect possible segmentation thresholds. The coarseness parameter is used to subsample the original volume to get a quick estimate:
Subsampled volume has size 12.5% of the original volume.